IN THIS SECTION
• Global inequalities by production
• Global inequalities by consumption
Global inequalities by production
There are two parameters that determine our collective carbon dioxide (CO2) emissions: the number of people, and quantity emitted per person. We either talk about total annual or per capita emissions. They tell very different stories and this often results in confrontation over who can really make an impact: rich countries with high per capita emissions, or those with a large population.
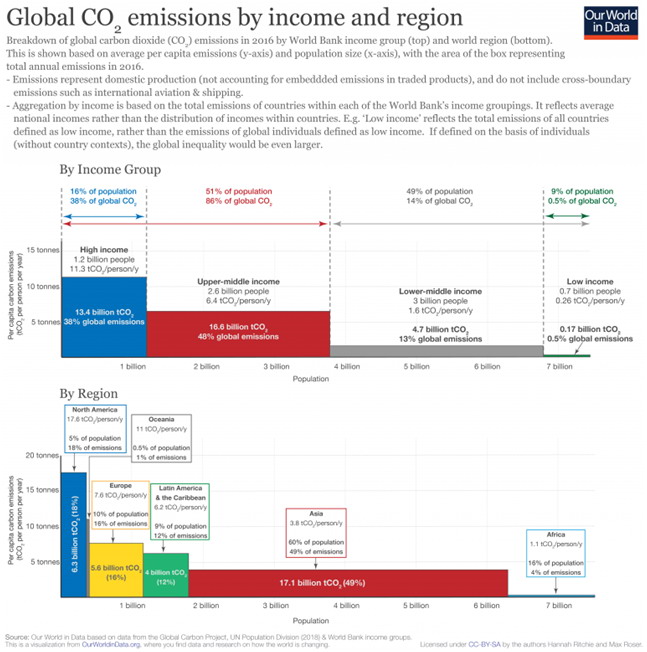
To help us understand the global distribution of per capita emissions and population, we have visualized global CO2 emissions by (1) World Bank income group and (2) by world region.
The world’s total CO2 emissions9 are shown on the basis of two axes: the height of the bar (y-axis) is the average per capita CO2 emissions and the length of the box (x-axis) is the total population. Since total emissions are equal to per capita emissions multiplied by the number of people, the area of each box represents total emissions.10
Emissions by country’s income
When aggregated in terms of income, we see in the visualization that the richest half (high and upper-middle income countries) emit 86 percent of global CO2 emissions. The bottom half (low and lower-middle income) only 14%. The very poorest countries (home to 9 percent of the global population) are responsible for just 0.5 percent. This provides a strong indication of the relative sensitivity of global emissions to income versus population. Even several billion additional people in low-income countries — where fertility rates and population growth is already highest — would leave global emissions almost unchanged. 3 or 4 billion low income individuals would only account for a few percent of global CO2. At the other end of the distribution however, adding only one billion high income individuals would increase global emissions by almost one-third.11
Note here that the summary by income is on the basis of country income groupings, rather than that of individuals. For example, ‘low income’ is the total emissions of all countries defined as low income, rather than the lowest income individuals in the world. These figures therefore don’t take account of inequalities in emissions within countries. It’s estimated that within-country inequalities in emissions can be as large as those between countries.12
If we were to calculate this distribution by the income of individuals, rather than countries, we’d see that the global inequalities in emissions would be even greater. The richest of the global population would be responsible for an even larger share of global emissions.
Emissions by world region
When aggregated by region we see that North America, Oceania, Europe, and Latin America have disproportionately high emissions relative to their population. North America is home to only five percent of the world population but emits nearly 18 percent of CO2 (almost four times as much). Asia and Africa are underrepresented in emissions. Asia is home to 60 percent of the population but emits just 49 percent; Africa has 16 percent of the population but emits just 4 percent of CO2. This is reflected in per capita emissions; the average North American is more than 17 times higher than the average African.
This inequality in global emissions lies at the heart of why international agreement on climate change has (and continues to be) so contentious. The richest countries of the world are home to half of the world population, and emit 86 percent of CO2 emissions. We want global incomes and living standards — especially of those in the poorest half — to rise. To do so whilst limiting climate change, it’s clear that we must shrink the emissions of high-income lifestyles. Finding the compatible pathway for levelling this inequality is one of the greatest challenges of this century.