The initial comparison of emissions by income group and region was based on ‘territorial’ emissions (those emitted within a country’s borders) — these are termed ‘production-based’ and are the metrics by which emissions are commonly reported. However, these emissions do not account for traded goods (for which CO2 was emitted for their production). If a country is a large importer of goods its production-based emissions would underestimate the emissions required to support its standard of living. Conversely, if a country is a large goods exporter, it includes emissions within its accounts which are ultimately exported for use or consumption elsewhere.
‘Consumption-based’ emissions correct for this by adjusting for trade. Consumption-based emissions are therefore: (production-based emissions – embedded CO2 in exported goods + embedded CO2 in imported goods). The Global Carbon Project (GCP) publishes estimates of these adjustments in their carbon budget.13 You can find much more information and data on emissions in trade in our full entry here.
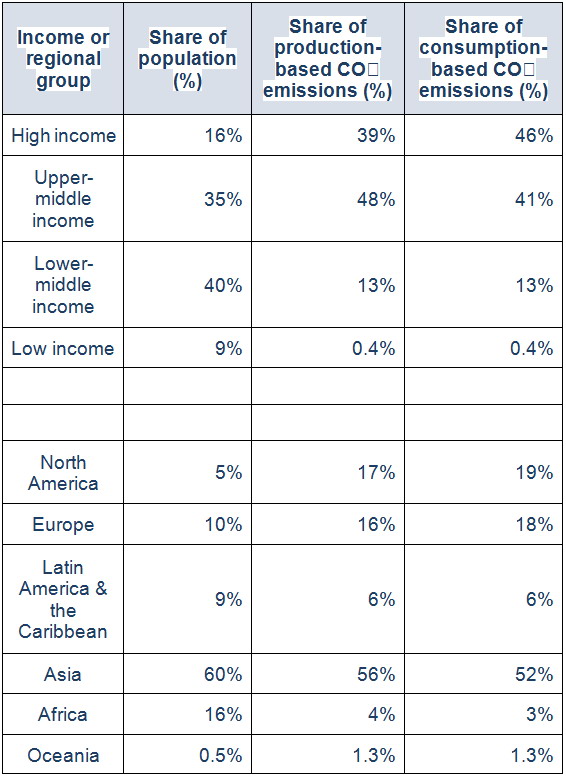
How do consumption-based emissions change the emission shares by income group and region? In the table I compare each group’s share of the world population, production- and consumption-based CO2 emissions.
On a production basis we had previously found that the richest (high and upper-middle income) countries in the world accounted for half of the population but 86 percent of emissions.14 On a consumption basis we find the same result, but resulting from the fact that upper-middle income countries primarily export emissions to high income countries. High income countries’ collective emissions increase from 39 to 46 percent when adjusted for trade (with only 16 percent of the population); upper-middle income countries’ emissions decrease by the same amount (7 percentage points) from 48 to 41 percent. Overall, this balances out in the top half of the world population: upper-middle income countries are net exporters whilst high income net importers.
In the bottom half, it appears that very little changes for the collective of lower-middle and low income countries: their production and consumption emissions shares are effectively the same.
By region we see that traded emissions tend to flow from Asia to North America and Europe (Asia’s share reduces when adjusted for trade whilst North America and Europe’s share increases).
Note here that consumption-based emissions are not available for all countries. Collectively, countries without consumption-based estimates due to poor data availability account for approximately 3 percent of global emissions. Many of the missing countries are at low and lower-middle incomes. With the addition of these countries, we would expect small percentage point shifts across the distribution. The challenges in accounting for carbon embedded in global trade15 mean these estimates are not perfect; nonetheless they should provide a good approximation of the global transfers across the world.
On a consumption basis, high-income countries (Europe and North America in particular) account for an even larger share of global emissions (46 percent — nearly three times their population share of 16 percent).